Technical walkthrough 02 · Geospatial data and research
CASFER national nutrient data
Distributed discovery and normalization work for a study of agricultural and municipal nutrient sources across 2,229 HUC-8 watersheds.
National coverage depended on identifiers that did not agree
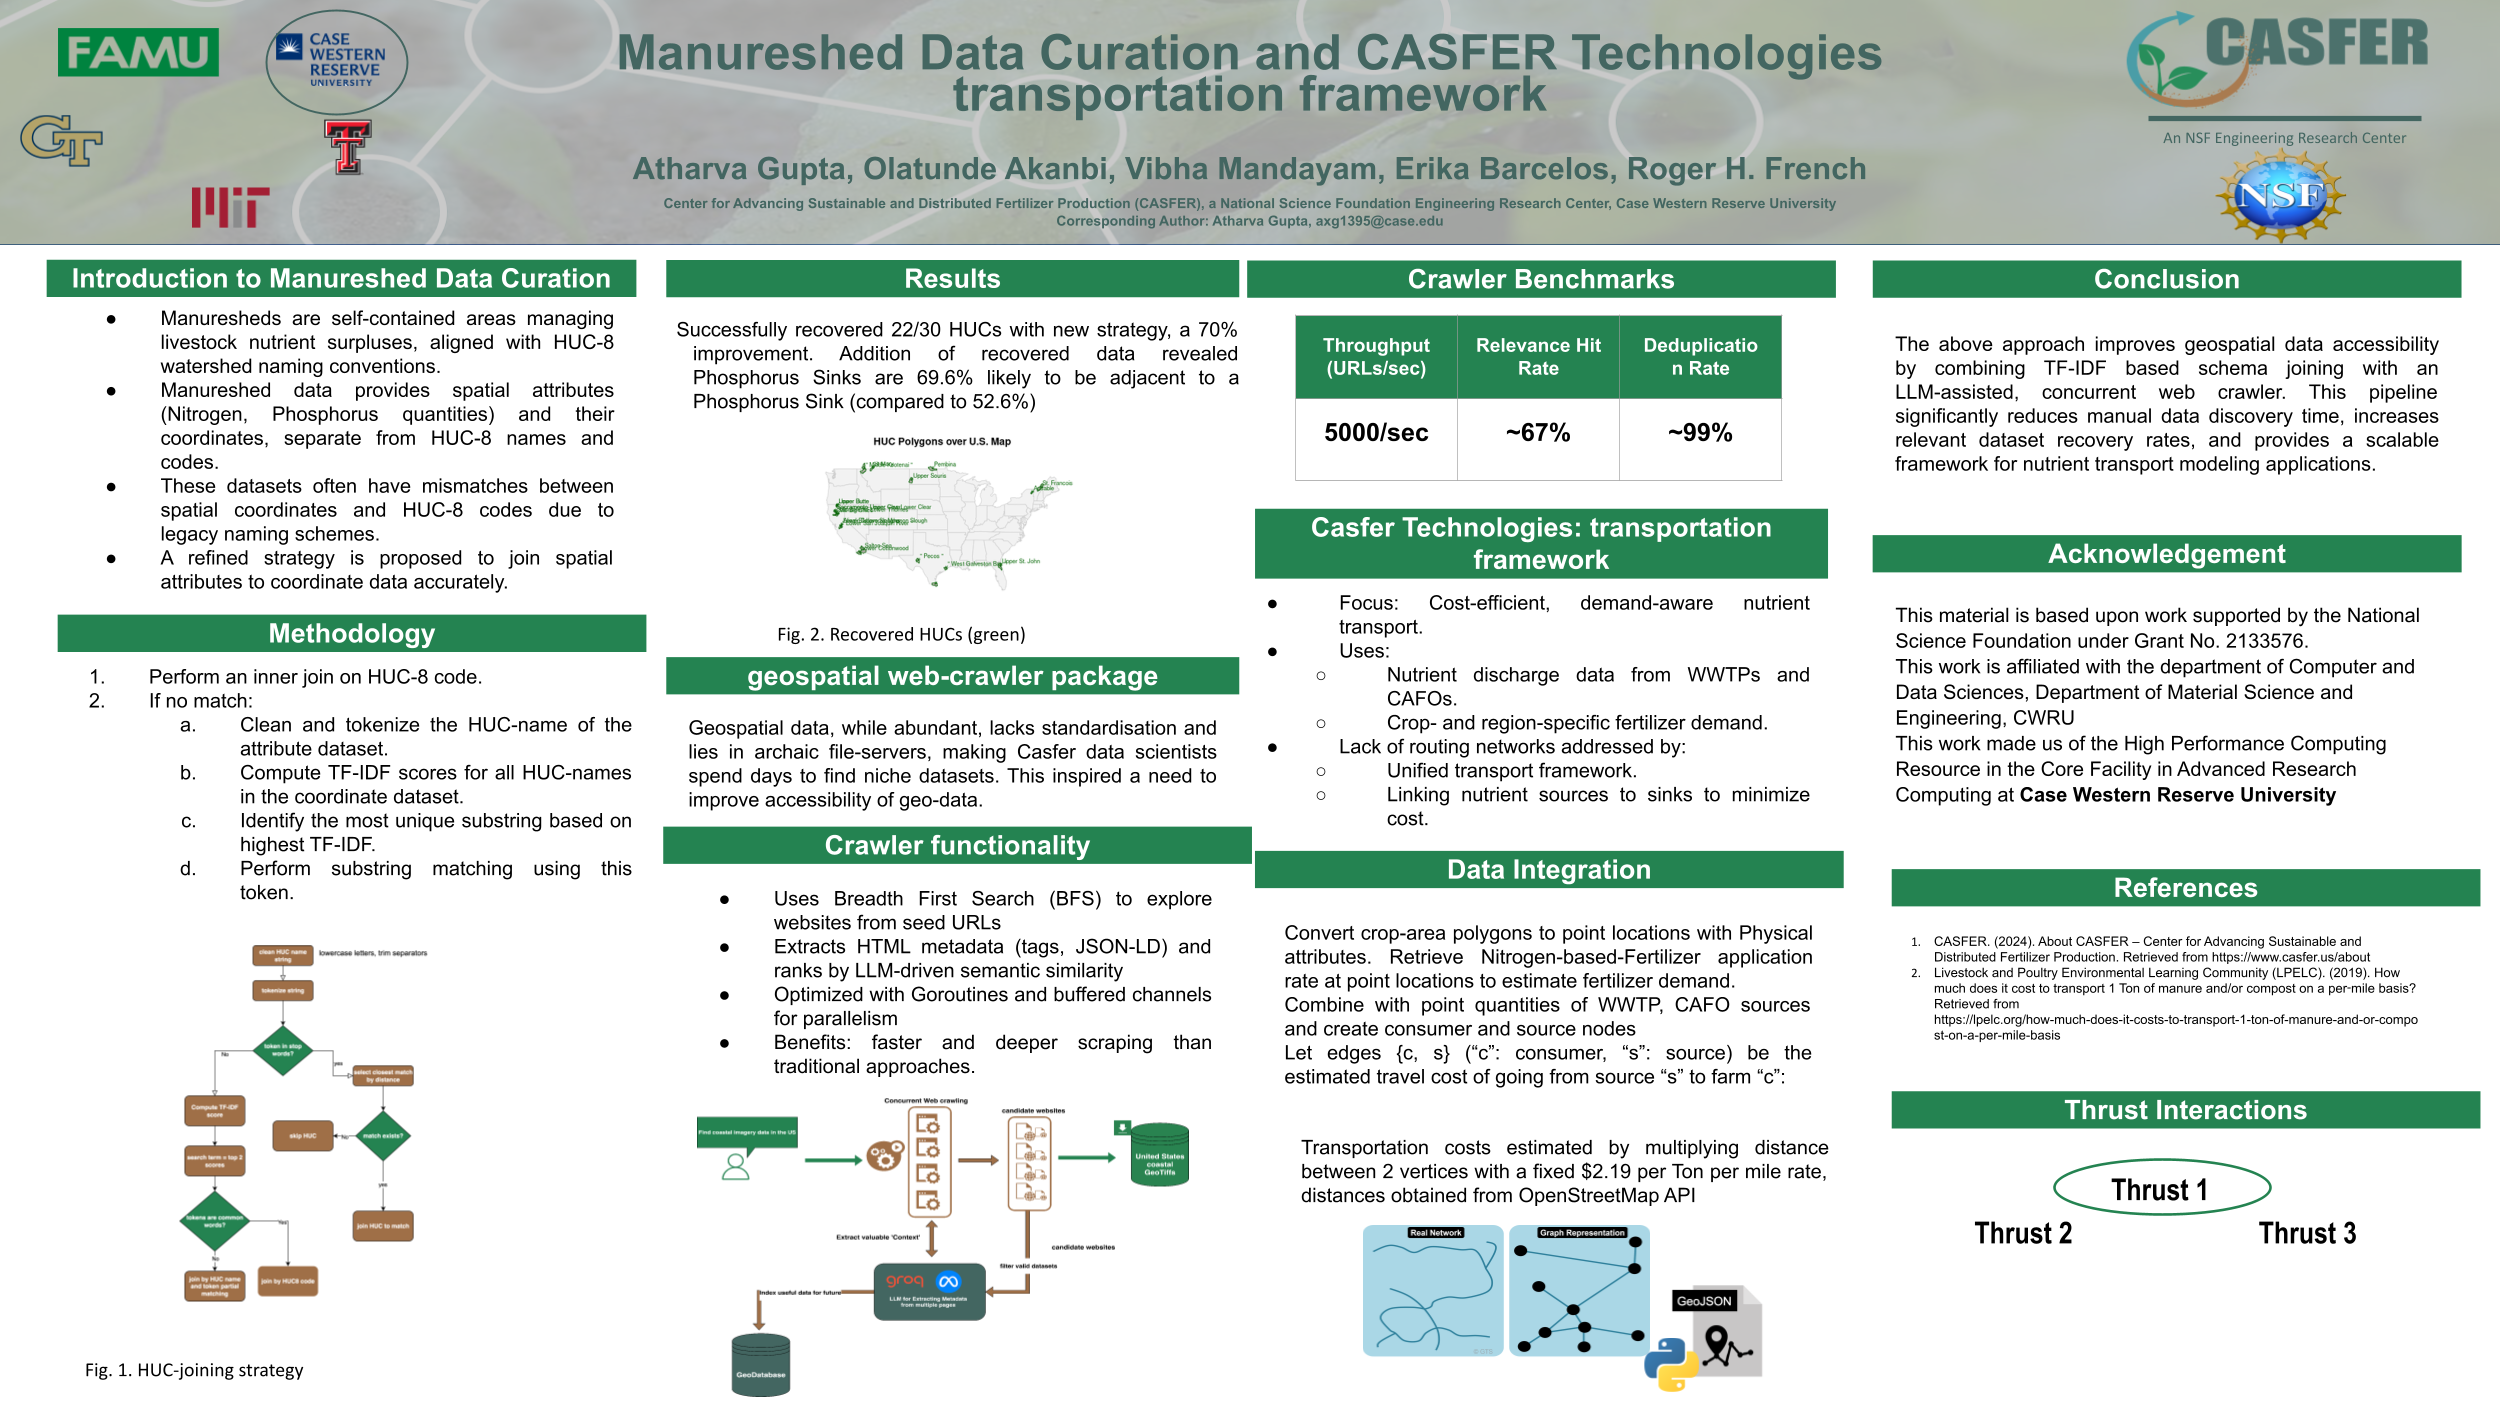
The study combined agricultural nutrient data, watershed boundaries, and wastewater-treatment discharge records. The sources differed in file format, spatial resolution, naming convention, and HUC-8 identifier quality. A file could be valid while still joining to the wrong watershed or disappearing from the national result.
The pipeline therefore treated provenance, coordinates, watershed ID, nutrient unit, and time range as part of the data contract—not as metadata to repair after aggregation.
Discovery, normalization, and spatial joins used separate contracts
| Boundary | Input problem | Output contract |
|---|---|---|
| Web discovery | Catalog pages, FTP indexes, APIs, and direct files | URL plus source, description, date range, CRS, and bounds |
| Manifest | Concurrent workers can rediscover or retry the same watershed | Shared inventory keyed by source and watershed scope |
| Raster ETL | GeoTIFF and NetCDF grids with different schemas | Normalized nitrate/phosphate cells in Geohash partitions |
| Identifier recovery | Legacy HUC names and codes fail exact joins | Candidate match checked against spatial coordinates |
| Analysis tables | Agricultural and WWTP data use different source definitions | Four watershed classes under agricultural-only and integrated scenarios |
The public crawler’s core state makes the concurrency boundary visible: a breadth-first worklist, two bounded token pools, a deduplication map, and a 50-record database batch.
type CrawlManager struct {
    searchQuery NormalizedQuery

    downloadURLs []CrawlNode
    dbBatch      [50]DatasetMetadata
    dbBatchCount int
    seen         map[string]bool

    linkChan chan struct{}
    smTokens chan struct{}    // crawl semaphore
    dlTokens chan struct{}    // download semaphore
    worklist chan []CrawlNode // breadth-first queue
    done     chan bool
}The crawler stores bounds, horizontal and vertical CRS, temporal coverage, source, and URL together. Relevance is insufficient if the file cannot later be placed in the correct spatial and temporal frame.
The paper turns watershed adjacency into a transition matrix
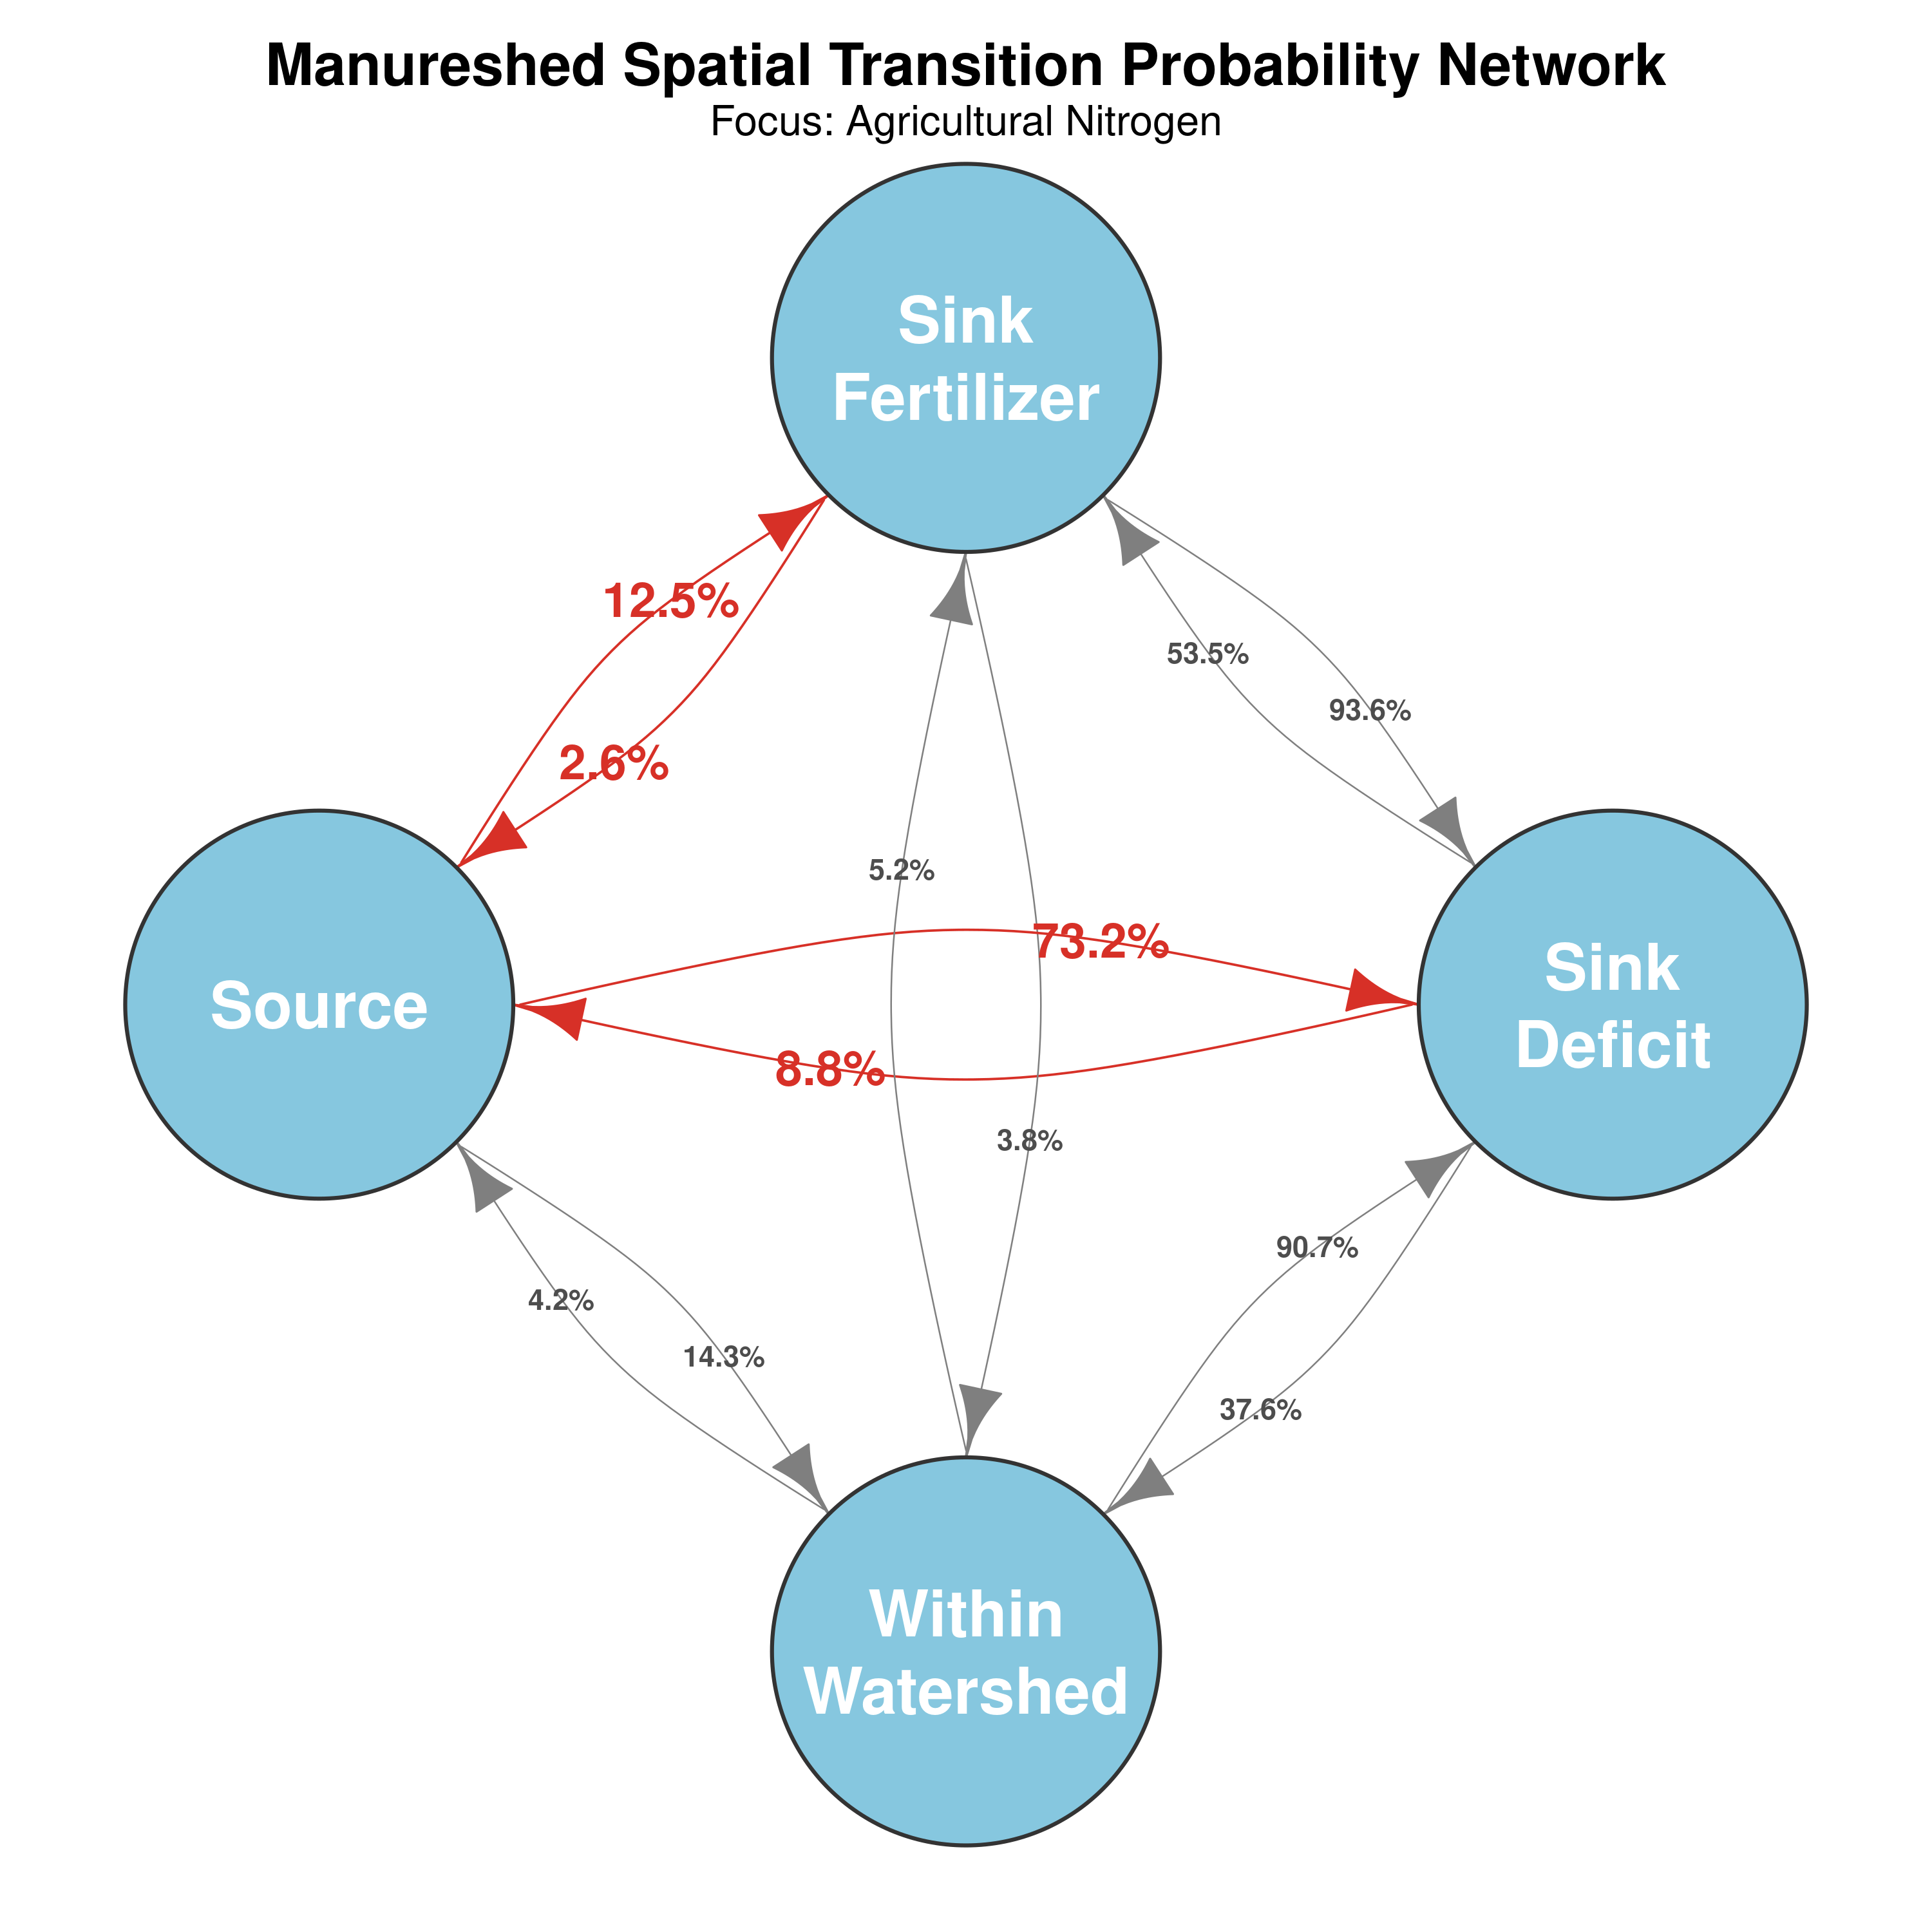
After classifying each watershed as source, sink deficit, sink fertilizer, or within-watershed balance, the analysis applies modified rook adjacency. Each neighboring pair with different classes increments both directions, because watershed adjacency is undirected.
This representation answers a practical question that a national map alone cannot: when a watershed has surplus nutrient, what fraction of its immediate neighbors are deficit areas that could plausibly receive it?
Data-engineering output and publication output
| Output | Observed | Scope |
|---|---|---|
| Watershed coverage | 2,229 HUC-8 watersheds | National ingestion and publication scope |
| Raster normalization | Estimated 20M+ nitrate/phosphate cells | Estimate retained; not presented as an exact row count |
| Identifier recovery | 22 HUC-8s recovered | Watersheds lost by the original identifier join |
| Image workflow | 60K+ geolocated records | 40K+ AFO and 20K+ CAFO records prepared with PySpark |
| Integrated nitrogen sources | 28 → 75 watersheds (+167.9%) | Published agricultural-only versus agricultural + WWTP classification |
| Integrated source-to-sink adjacency | 85.7% → 89.5% | Published nitrogen transition analysis |
The first four rows are resume-scoped engineering claims. The final two are paper results reported in Resources, Conservation and Recycling 226 (2026).
What these outputs do and do not prove
- Adjacency is a screening signal for local redistribution; it is not a completed route plan, cost model, or transport commitment.
- The 20M+ raster-cell figure is an estimate and should remain labeled as one.
- The internship poster records the implementation snapshot at that time. Its crawler benchmark panel is not used here as a production throughput claim.
- The paper result is collaborative. My stated contribution is data curation and validation across the 2,229-watershed study.
Join the high-probability adjacency edges to road-network distance, actual nutrient quantities, and transport cost, then report how many apparent local opportunities remain feasible.